> ## Documentation Index
> Fetch the complete documentation index at: https://interceptor-docs.requestly.com/llms.txt
> Use this file to discover all available pages before exploring further.
# Browser Interception
Once you’ve installed the Requestly Interceptor browser extension, you can start intercepting, inspecting, and modifying HTTP(S) traffic directly in your browser. This feature is great for testing APIs, debugging frontend issues, and simulating server responses, without touching your backend or deploying changes.
This guide assumes you’ve already installed the [`Requestly Interceptor browser extension`](https://requestly.com/downloads) for your browser. If not, start there.
### Steps to Intercept traffic in Browser DevTools
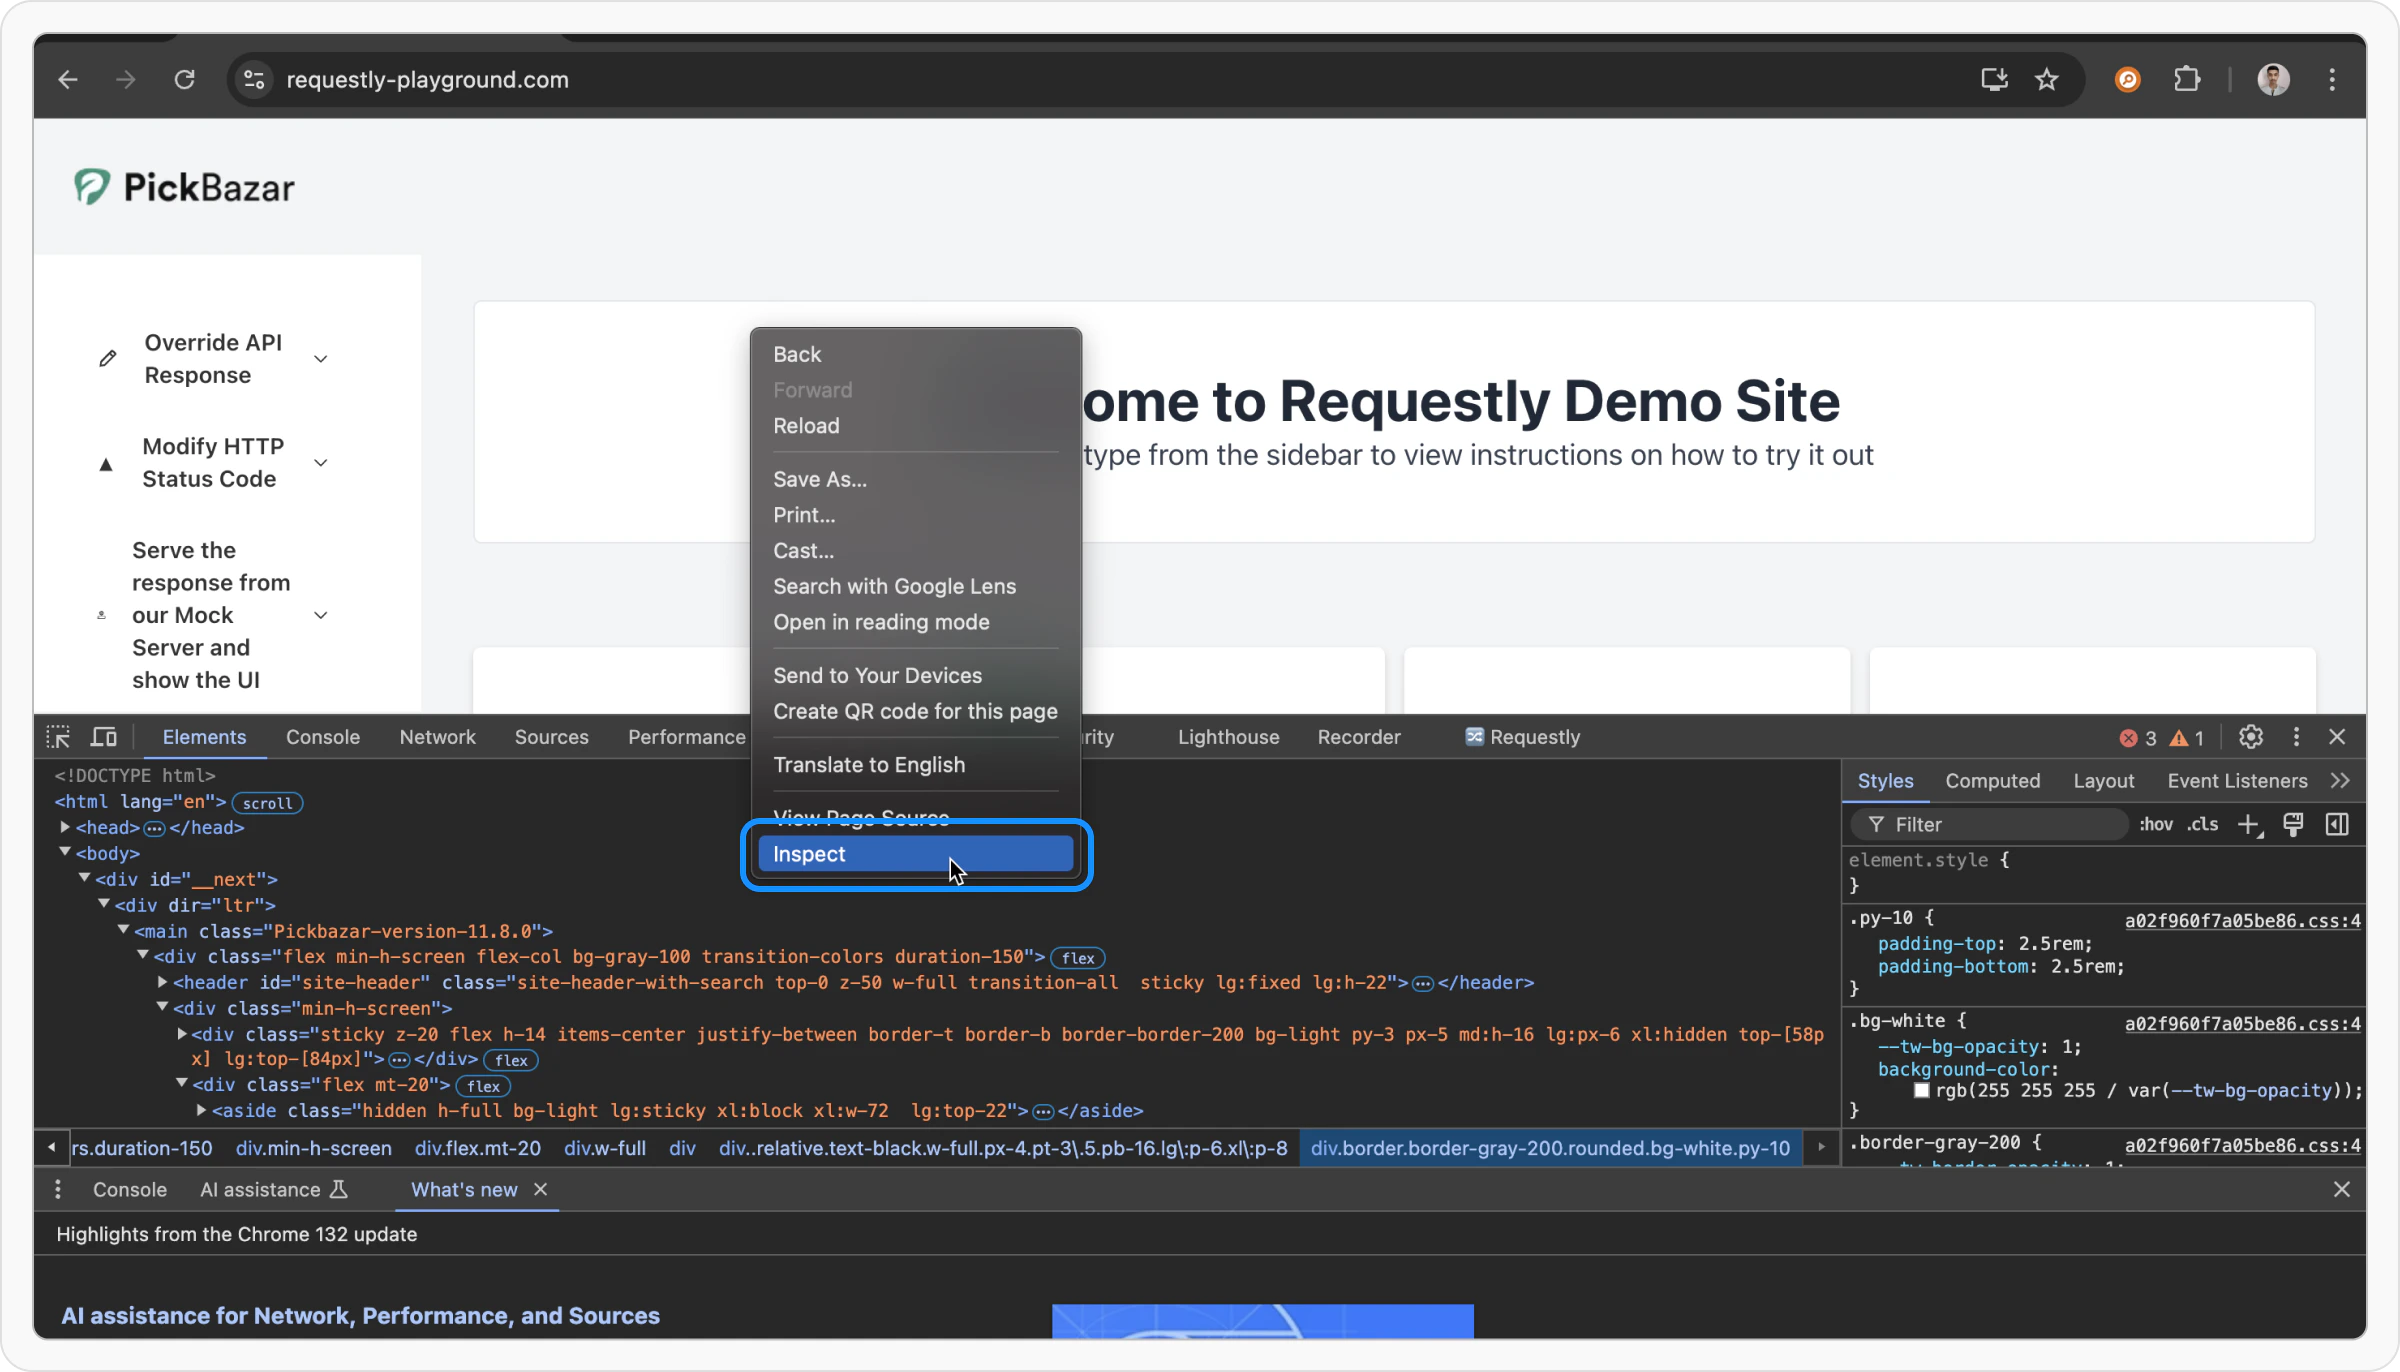
Right-click on the webpage and click **Inspect**.
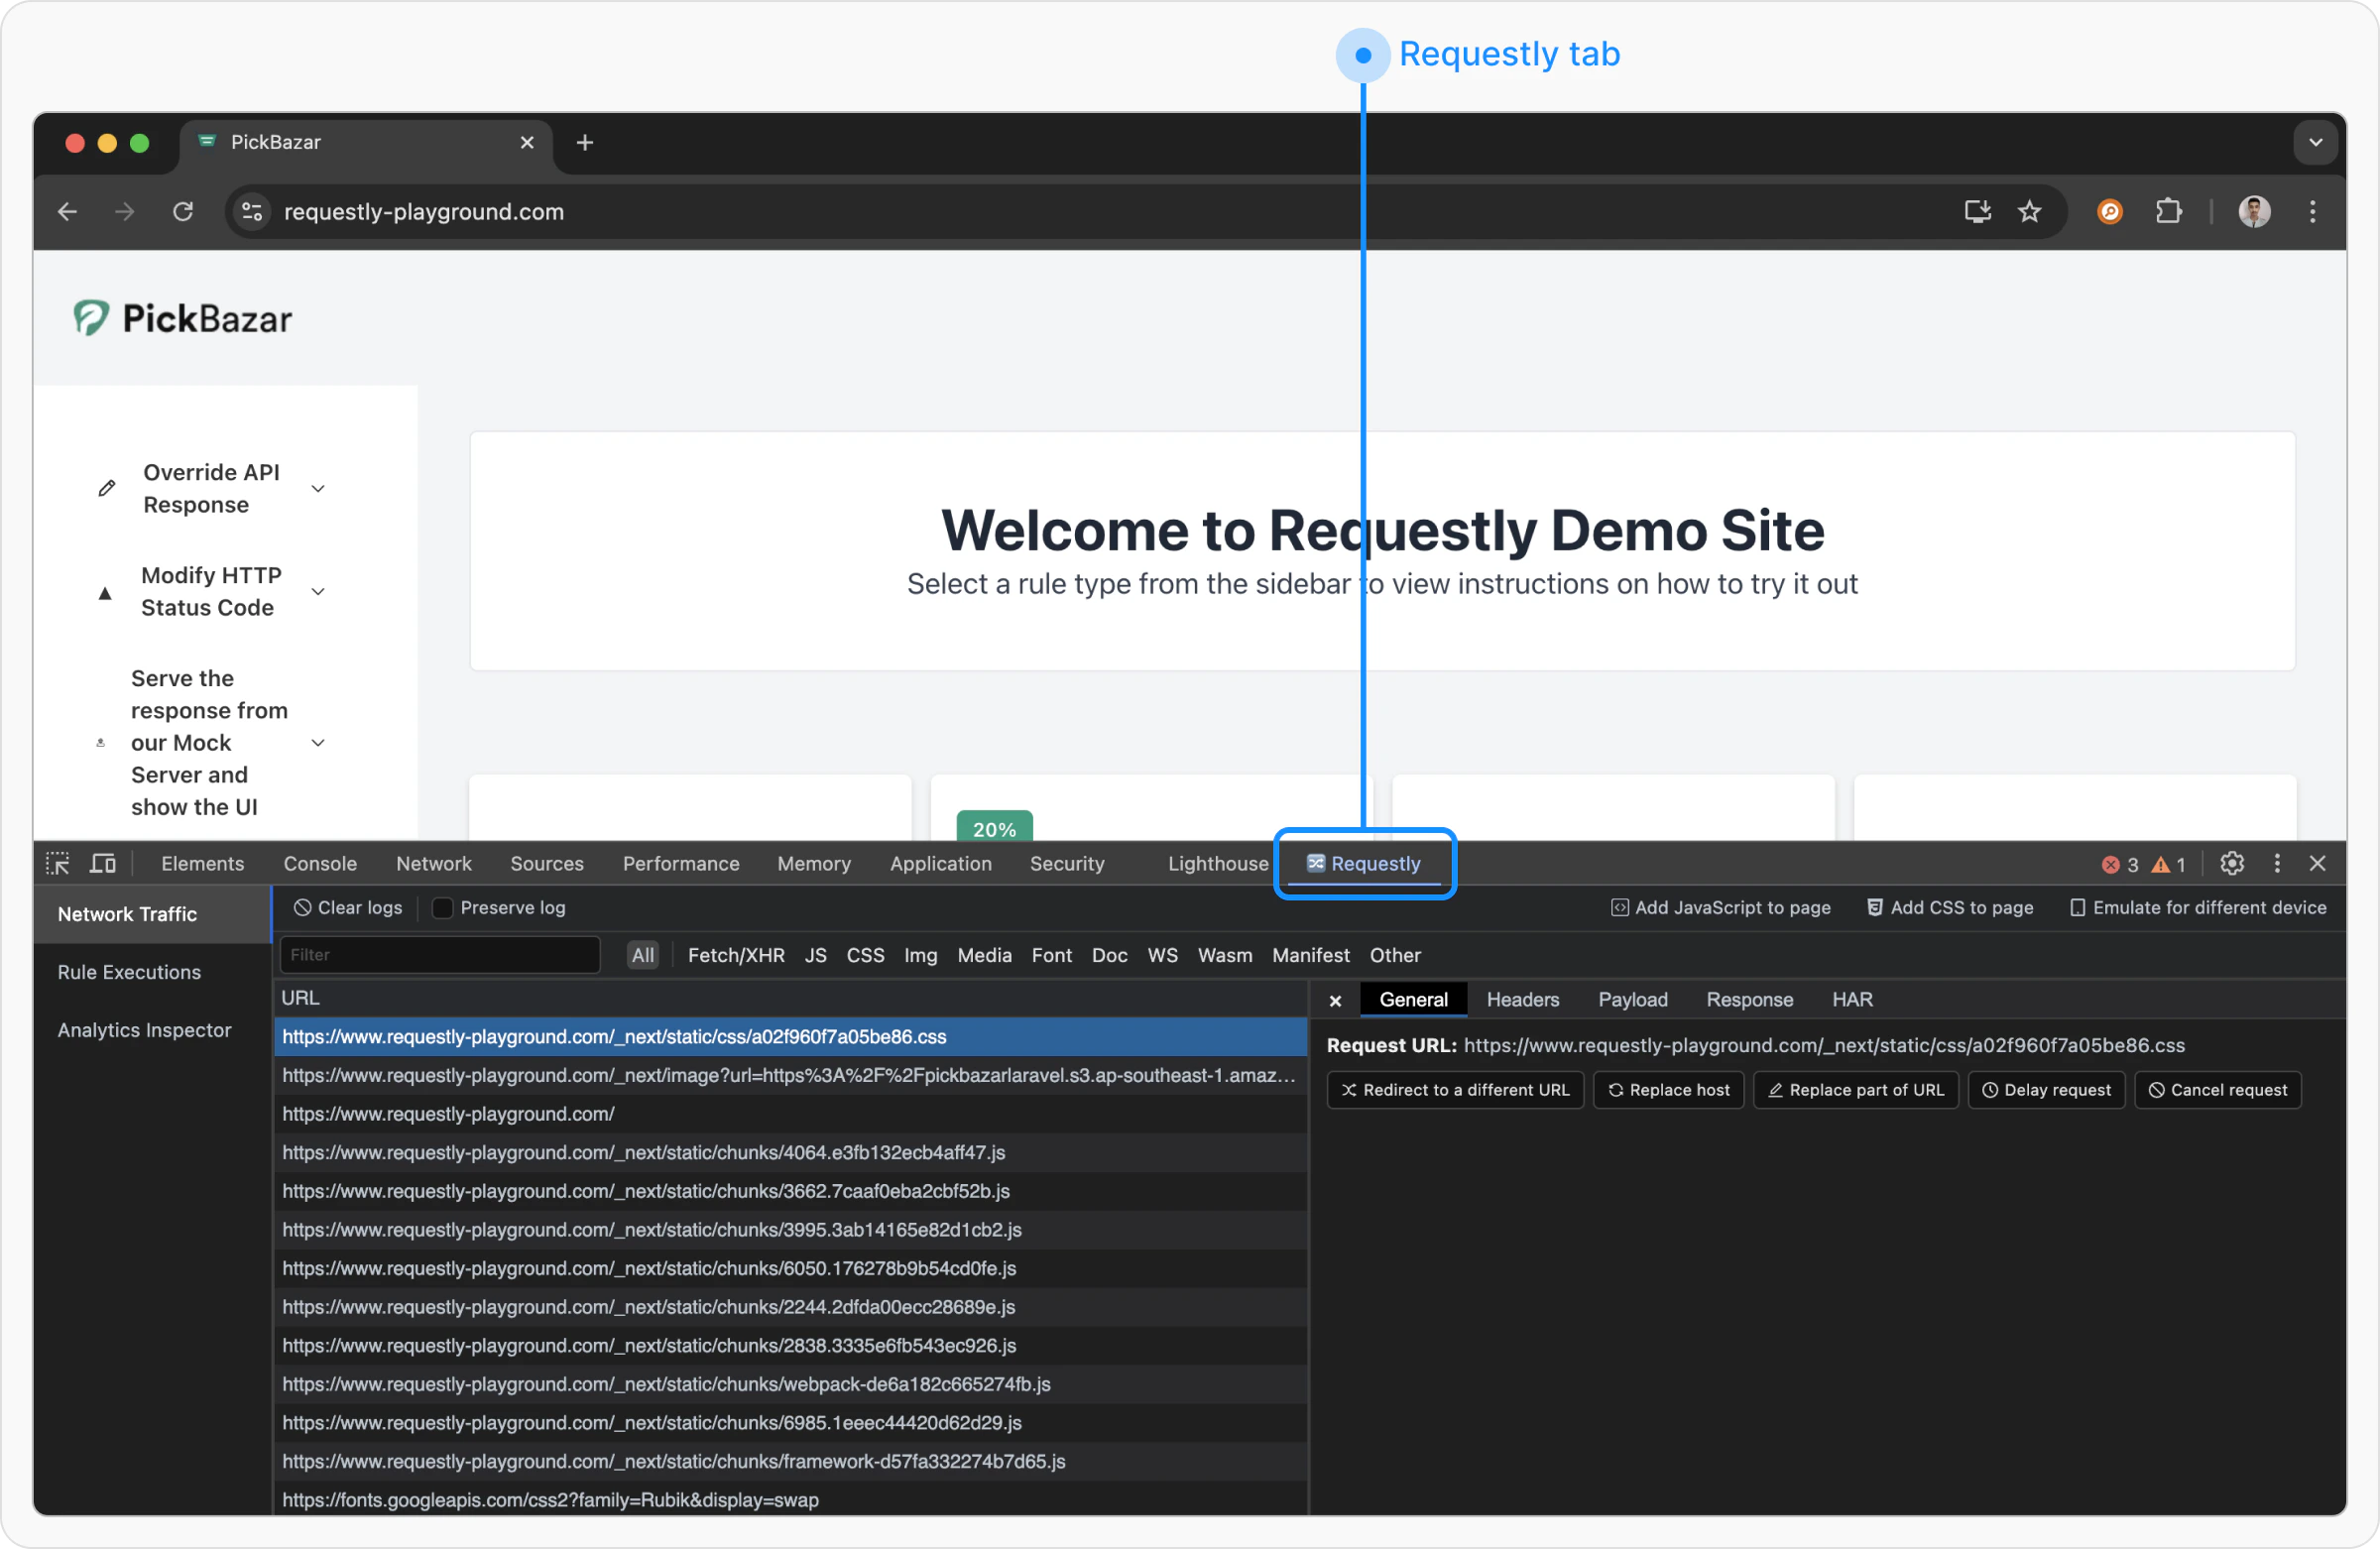
 Click on the **Requestly Interceptor** tab.
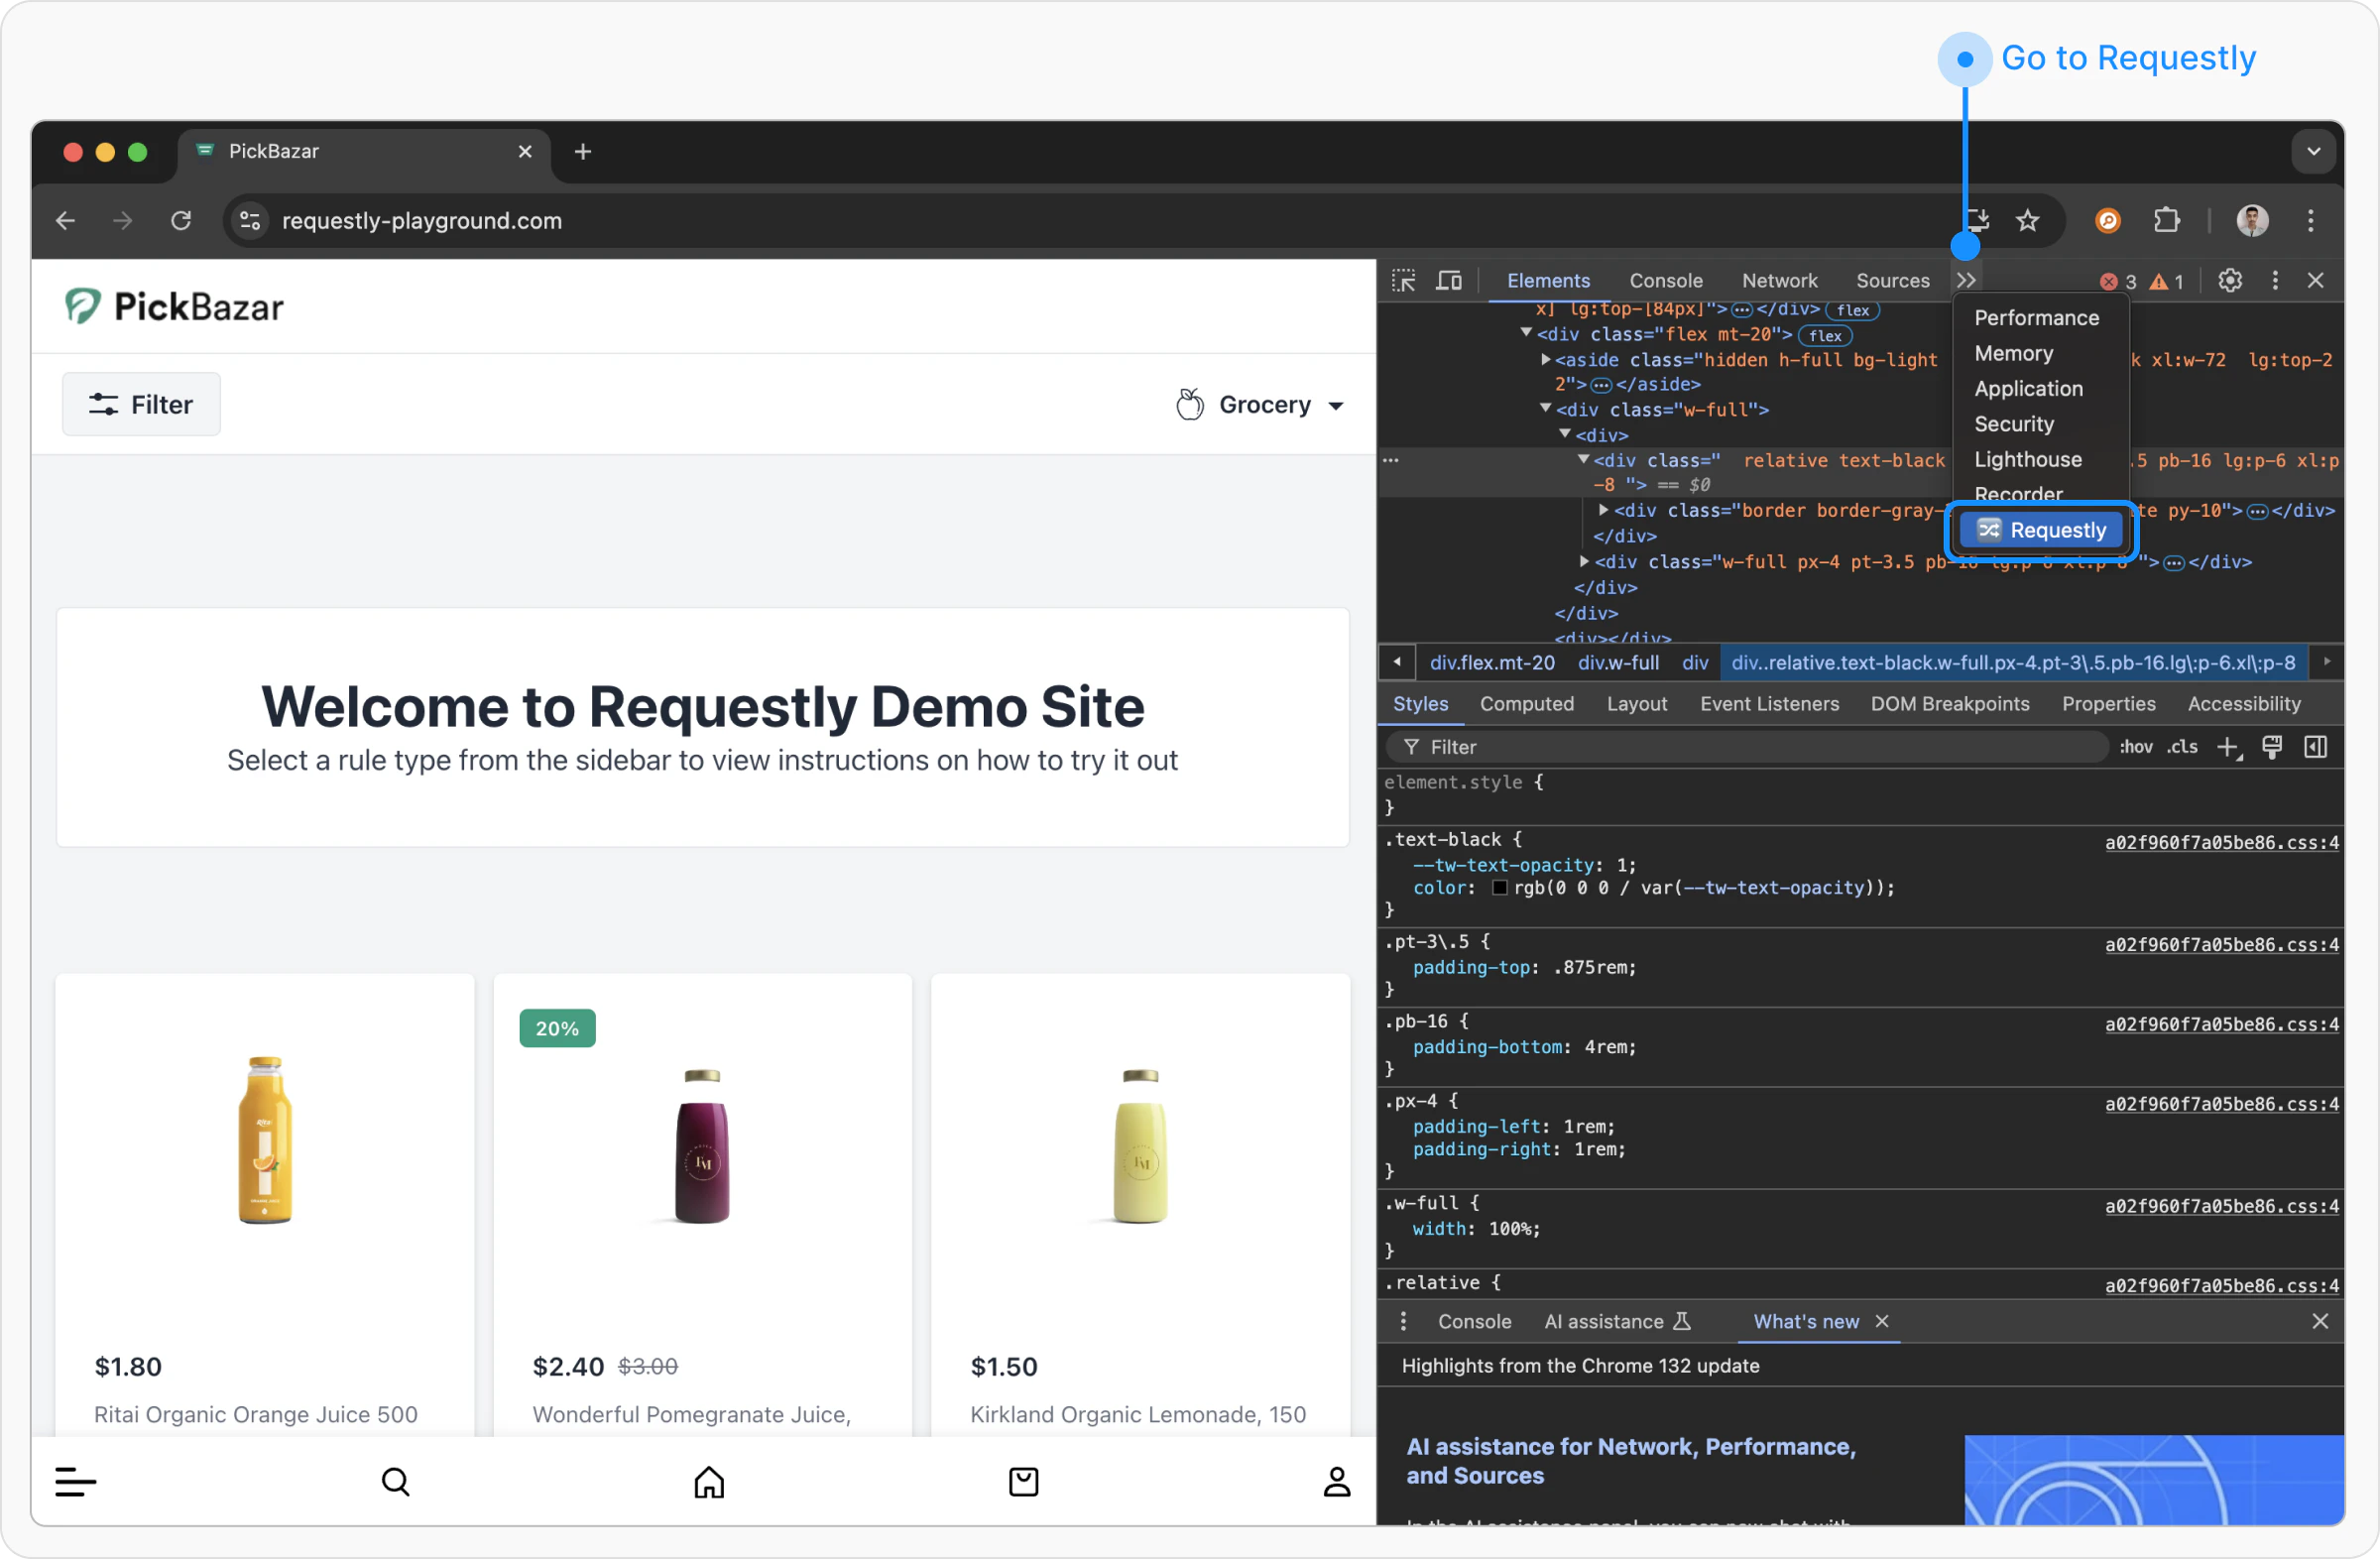
 If it is not visible, click on the **>>** button to expand the hidden tabs and then select **Requestly Interceptor**
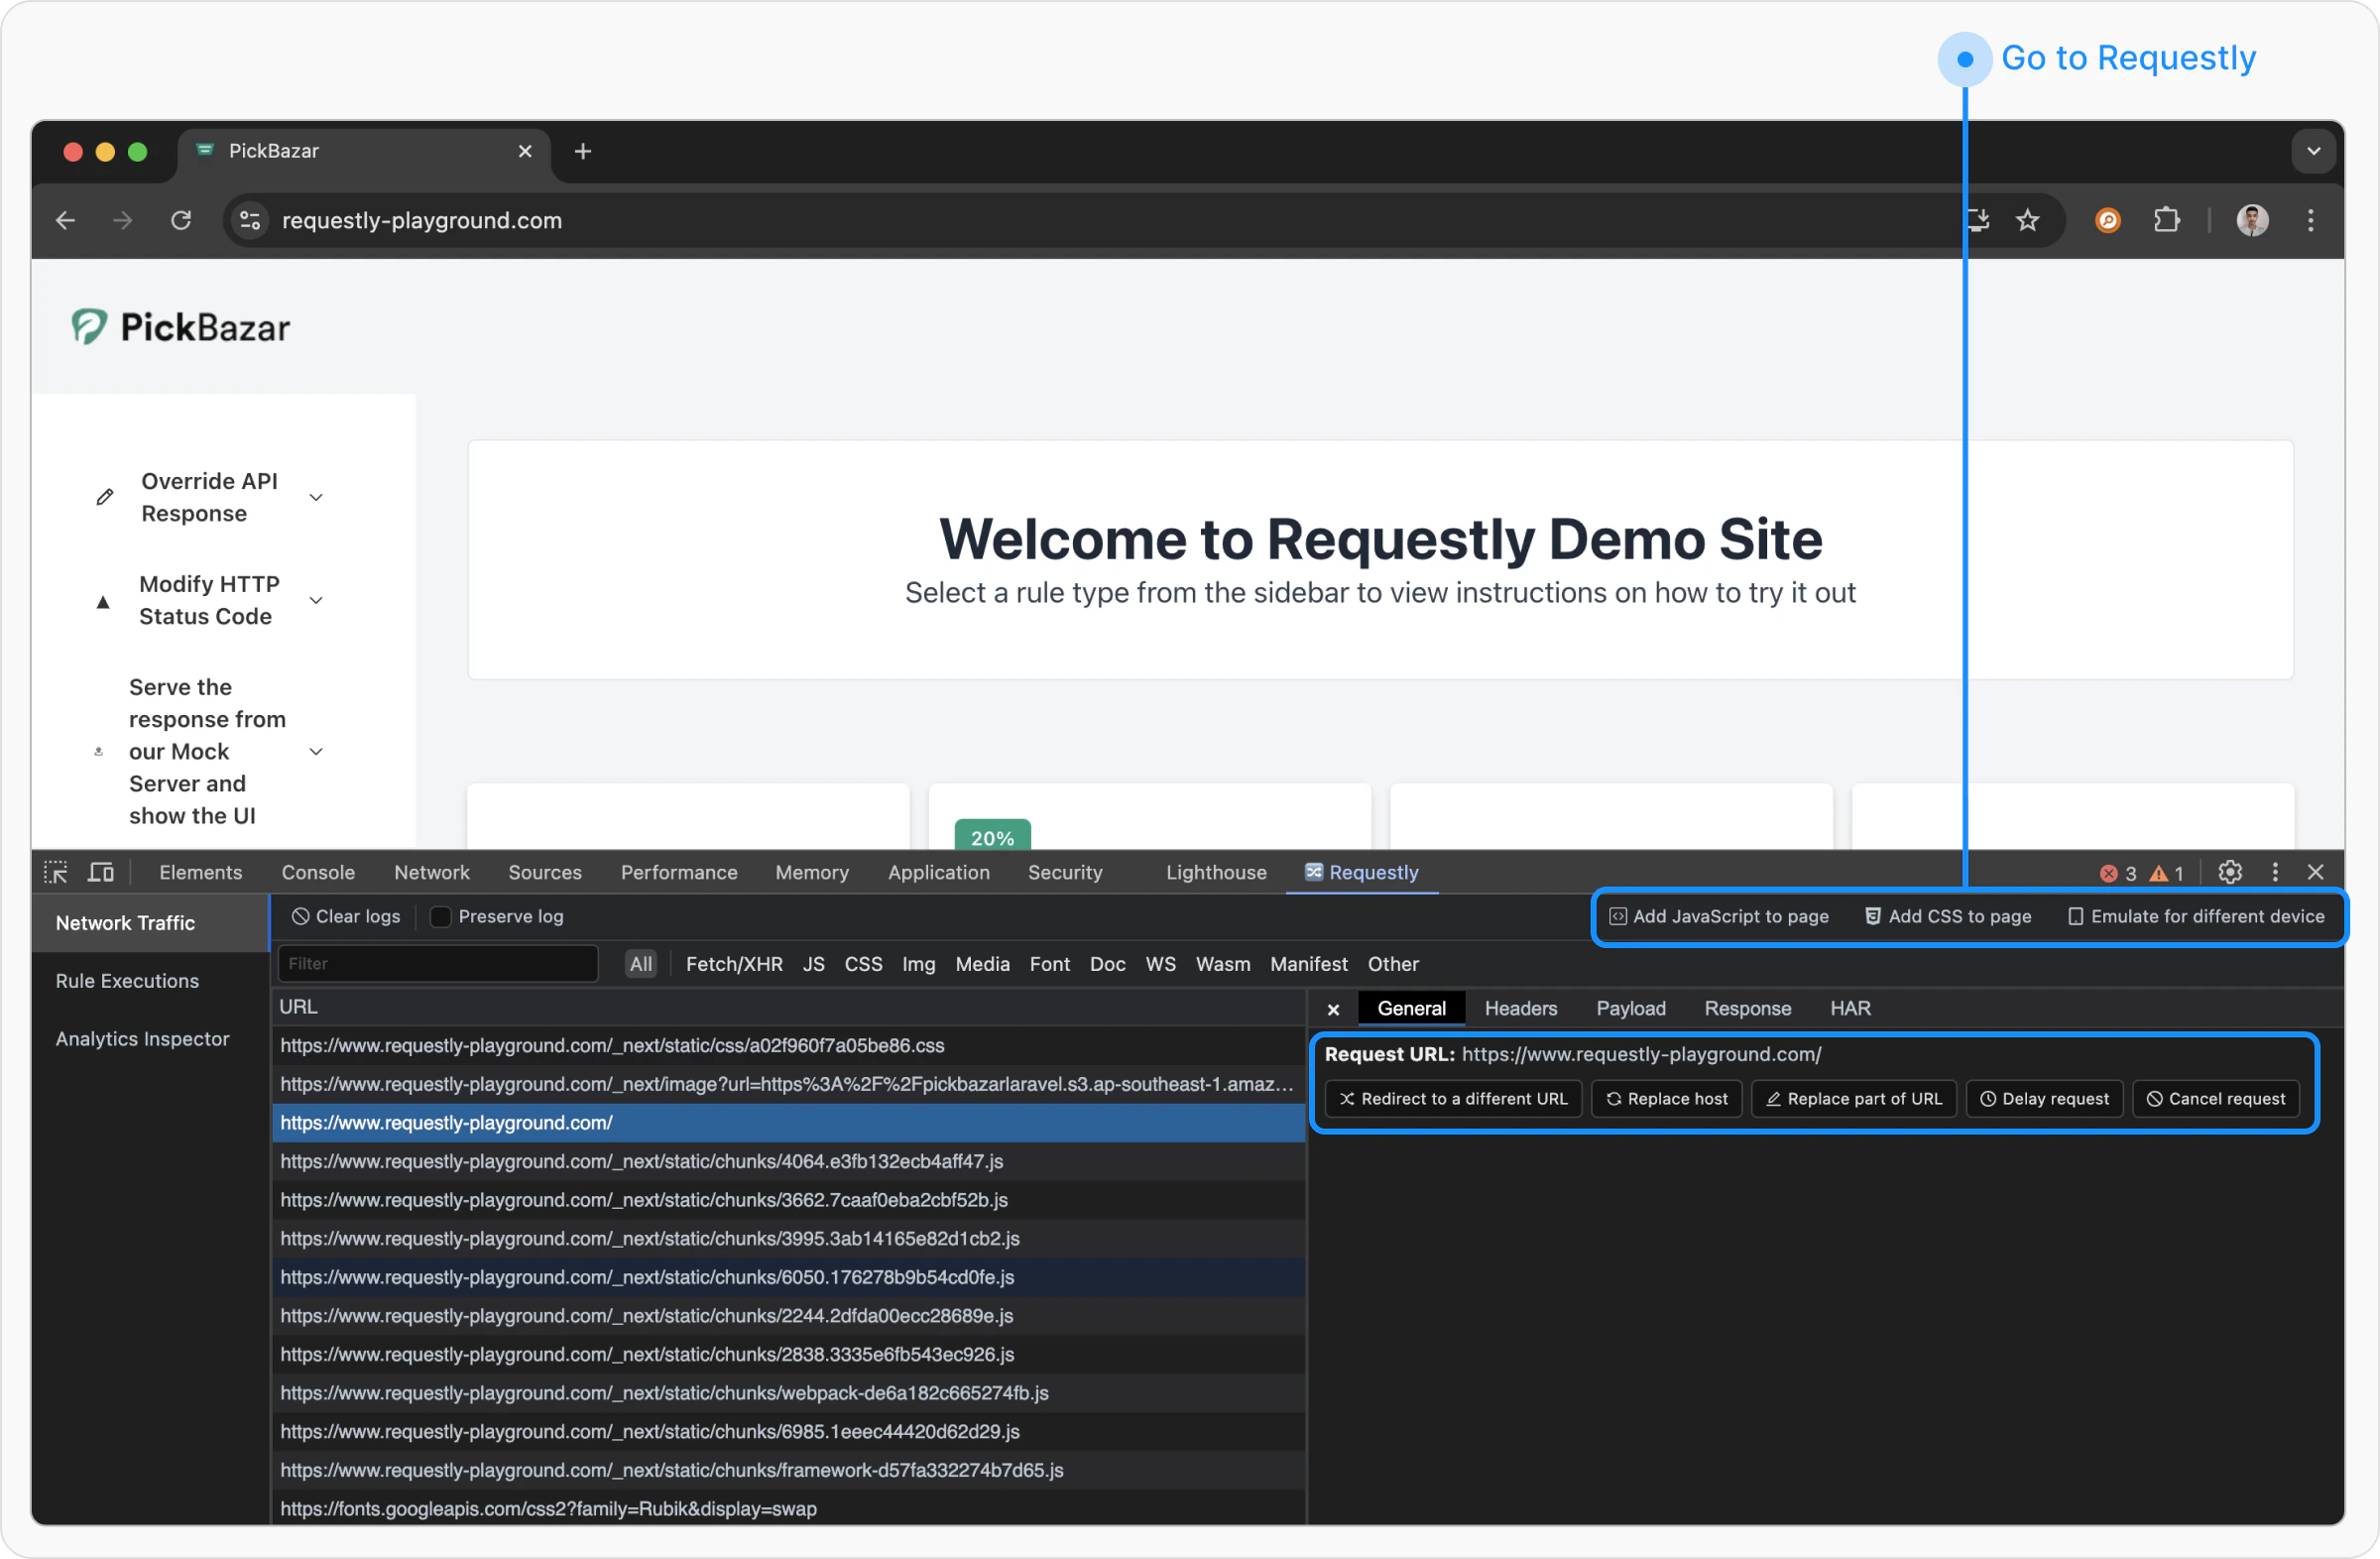
 Once open, this tab will list out all the requests made by your browser. Here, you have two tabs:
 If you want to intercept traffic from another browser extension, please use the [Requestly Interceptor Desktop App](/interceptor/desktop-app#desktop-app) instead.
The **Network Traffic** tab displays a network table where all requests and responses from the webpage are listed. This tab provides debugging options such as:
* **Add JavaScript to Page**: Injects custom JavaScript into the webpage.
* **Add CSS to Page**: Applies custom styles to the page.
* **Emulate a Different Device**: Simulates how the page renders on different devices.
Clicking on any request in the network table reveals detailed information, including request headers, request body, and response body. Additionally, users have the option to create a rule directly from the network table for the selected request.
The available rule creation options are:
* **Redirect to Another URL**
* **Replace Host**
* **Replace Part of URL**
* **Delay Request**
* **Cancel Request**
Clicking any of these buttons will take you to the Requestly Interceptor dashboard with some parameters set, Here you can customize and apply your modifications.
If you want to intercept traffic from another browser extension, please use the [Requestly Interceptor Desktop App](/interceptor/desktop-app#desktop-app) instead.
The **Network Traffic** tab displays a network table where all requests and responses from the webpage are listed. This tab provides debugging options such as:
* **Add JavaScript to Page**: Injects custom JavaScript into the webpage.
* **Add CSS to Page**: Applies custom styles to the page.
* **Emulate a Different Device**: Simulates how the page renders on different devices.
Clicking on any request in the network table reveals detailed information, including request headers, request body, and response body. Additionally, users have the option to create a rule directly from the network table for the selected request.
The available rule creation options are:
* **Redirect to Another URL**
* **Replace Host**
* **Replace Part of URL**
* **Delay Request**
* **Cancel Request**
Clicking any of these buttons will take you to the Requestly Interceptor dashboard with some parameters set, Here you can customize and apply your modifications.